The Product Sales Summary & Analysis report is one of the most valuable tools in MediaOS for tracking product performance across your sales and delivery cycles. Designed for sales teams, revenue leads, and leadership alike, this report helps you uncover trends, evaluate what's selling, and build custom insights that drive smarter decisions. With flexible filters, drill-down data, and exportable reports, it’s the fastest way to translate product activity into strategic action.
Accessing the Report #
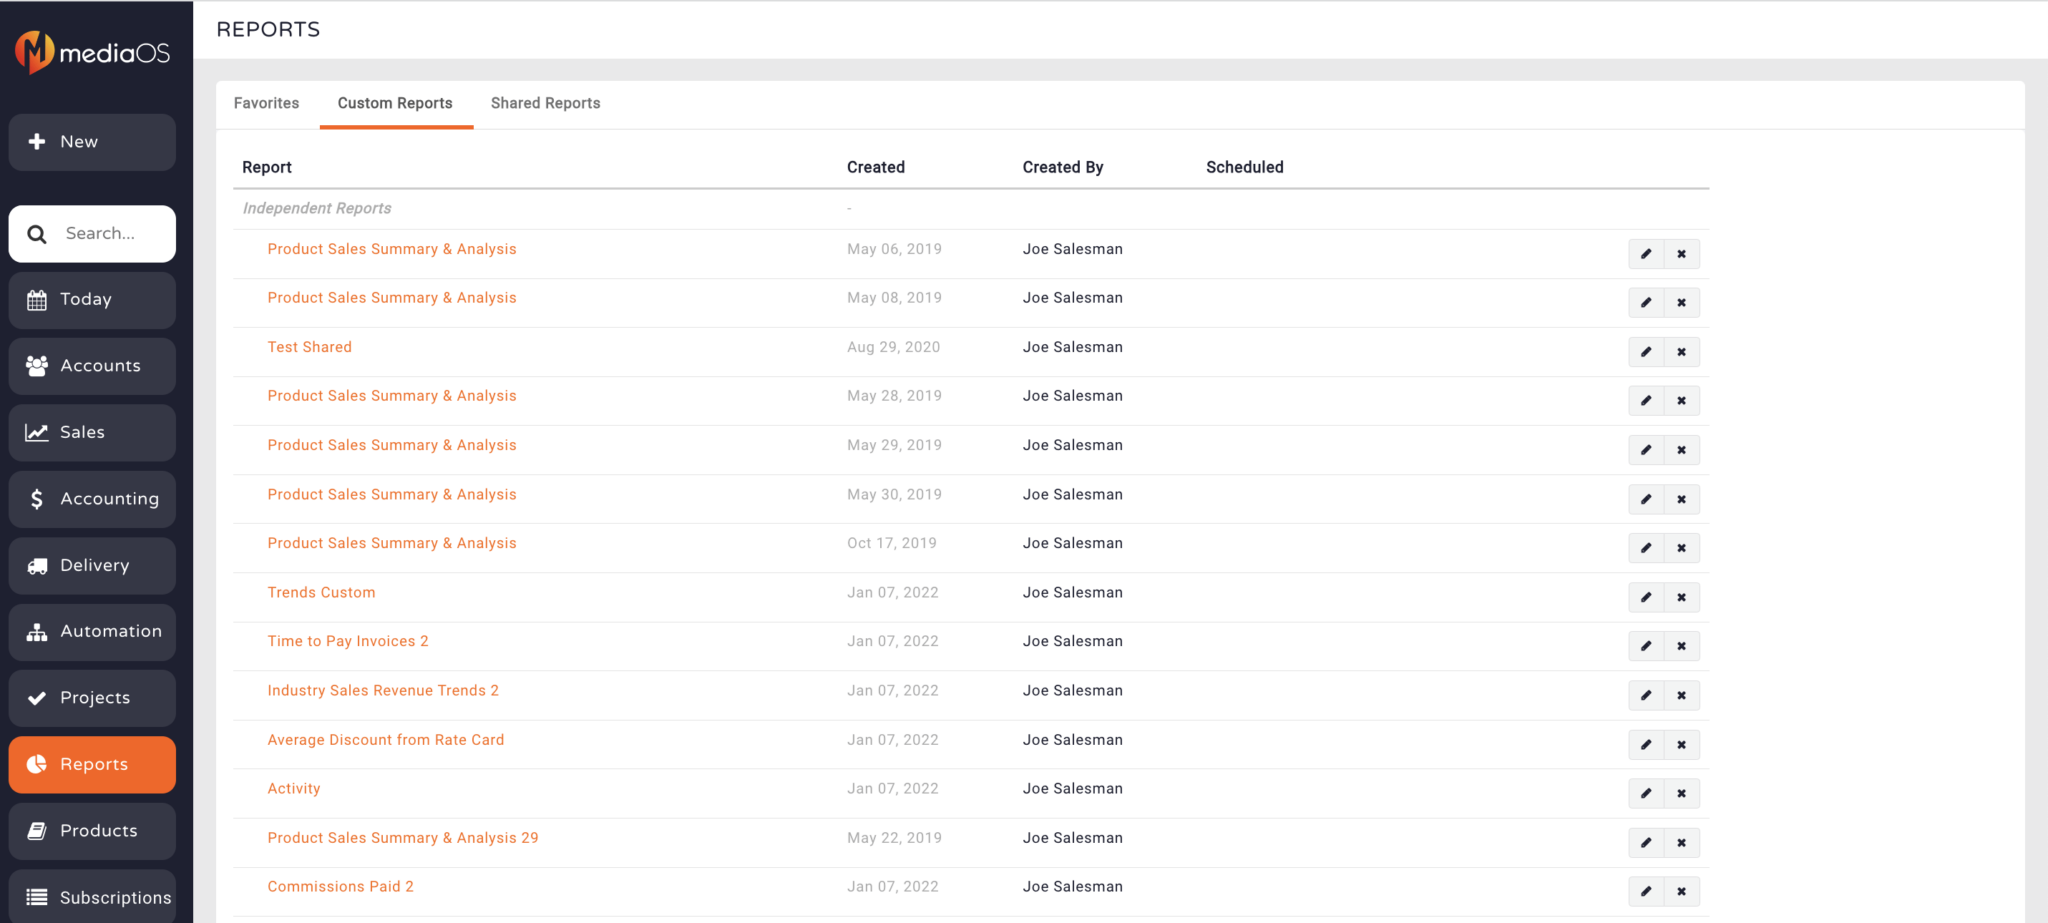
To get started, click the Reports tab from the left-hand navigation menu. Within the Sales Management section, select Product Sales Summary & Analysis. This will open the report builder, where you can customize filters, columns, and data sets to suit your specific reporting goals.
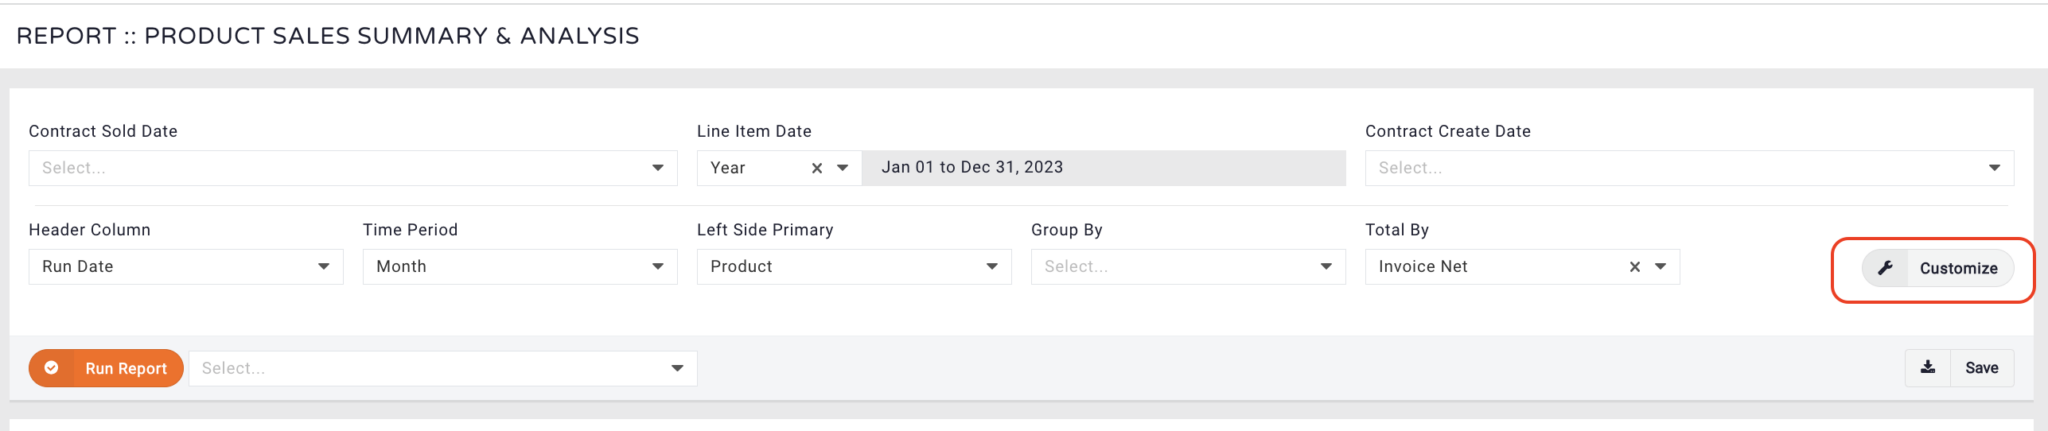
At the top of the screen, you’ll see dropdown menus for selecting your Left Side Primary Column, Header Column, and Total By grouping. These choices control how your data is organized across the report—giving you full flexibility to analyze by product, team, account, or timeline.
Top Filtering Definitions #
The filtering system within the Product Sales Summary & Analysis report allows you to control the time-based view of your data with precision. You can choose to filter based on when a contract was sold, which helps you evaluate performance tied to closing dates. Alternatively, filtering by when a line item is running enables you to analyze sales data based on delivery timelines, offering insights into products actively in market. Finally, selecting when a contract was created allows you to track early-stage pipeline activity. Each of these filters gives you a unique perspective on product success, helping you align reporting with both sales and operational goals.
Customizing Your Report #
Once your filters are applied, you can dig deeper into the data by clicking on any of the numbers within the report. Each number acts as a drill-down entry point, allowing you to refine the dataset with additional filtering options.
To further personalize the view, click Customize in the upper-right corner of the filter menu. This will open a panel where you can add more data fields, reorder columns, and select from advanced segmentation options to tailor the report to your specific objectives.
Saving and Sharing Custom Reports #
When you’ve finalized your report configuration, click the Save button in the bottom-right corner of the filter panel. Enter a report name, and if desired, assign it to a dashboard or report group. After naming and assigning, click Save again to confirm.
If you assign the report to a group, you’ll be prompted to name the group, select the users within it, and schedule a send time. MediaOS will then email the report to all members of the group at the designated date and time—automating your recurring reporting tasks.
You can even add recipients who aren’t MediaOS users by entering their email addresses manually. This makes it easy to share reports with stakeholders outside the platform.
To revisit your saved reports, return to the Reports tab and scroll to the Custom Reports section. From here, you can open, edit, or remove any reports you’ve created.