The Transaction and Transaction Summary Reports in MediaOS give your team the power to track revenue, review payment activity, and generate accurate financial snapshots with ease. Whether you need a detailed ledger of individual transactions or a high-level overview of payment trends by product, these tools help you simplify reporting, support audits, and keep leadership aligned with real-time financial performance.
How to Access the Transaction Report #
To access the Transaction Report, navigate to the Reports tab located in the left-hand navigation menu of MediaOS. From the reports list, click on Transaction to open the reporting screen. Once inside, you can customize your view by applying filters based on date range, product category, or other parameters relevant to your reporting needs.
If you frequently reference this report, you can also add it directly to your dashboard for quicker access.
Tip: Saving the Transaction Report to your dashboard ensures you have real-time financial visibility without having to reconfigure filters every time you log in.

Accessing the Transaction Summary Report #
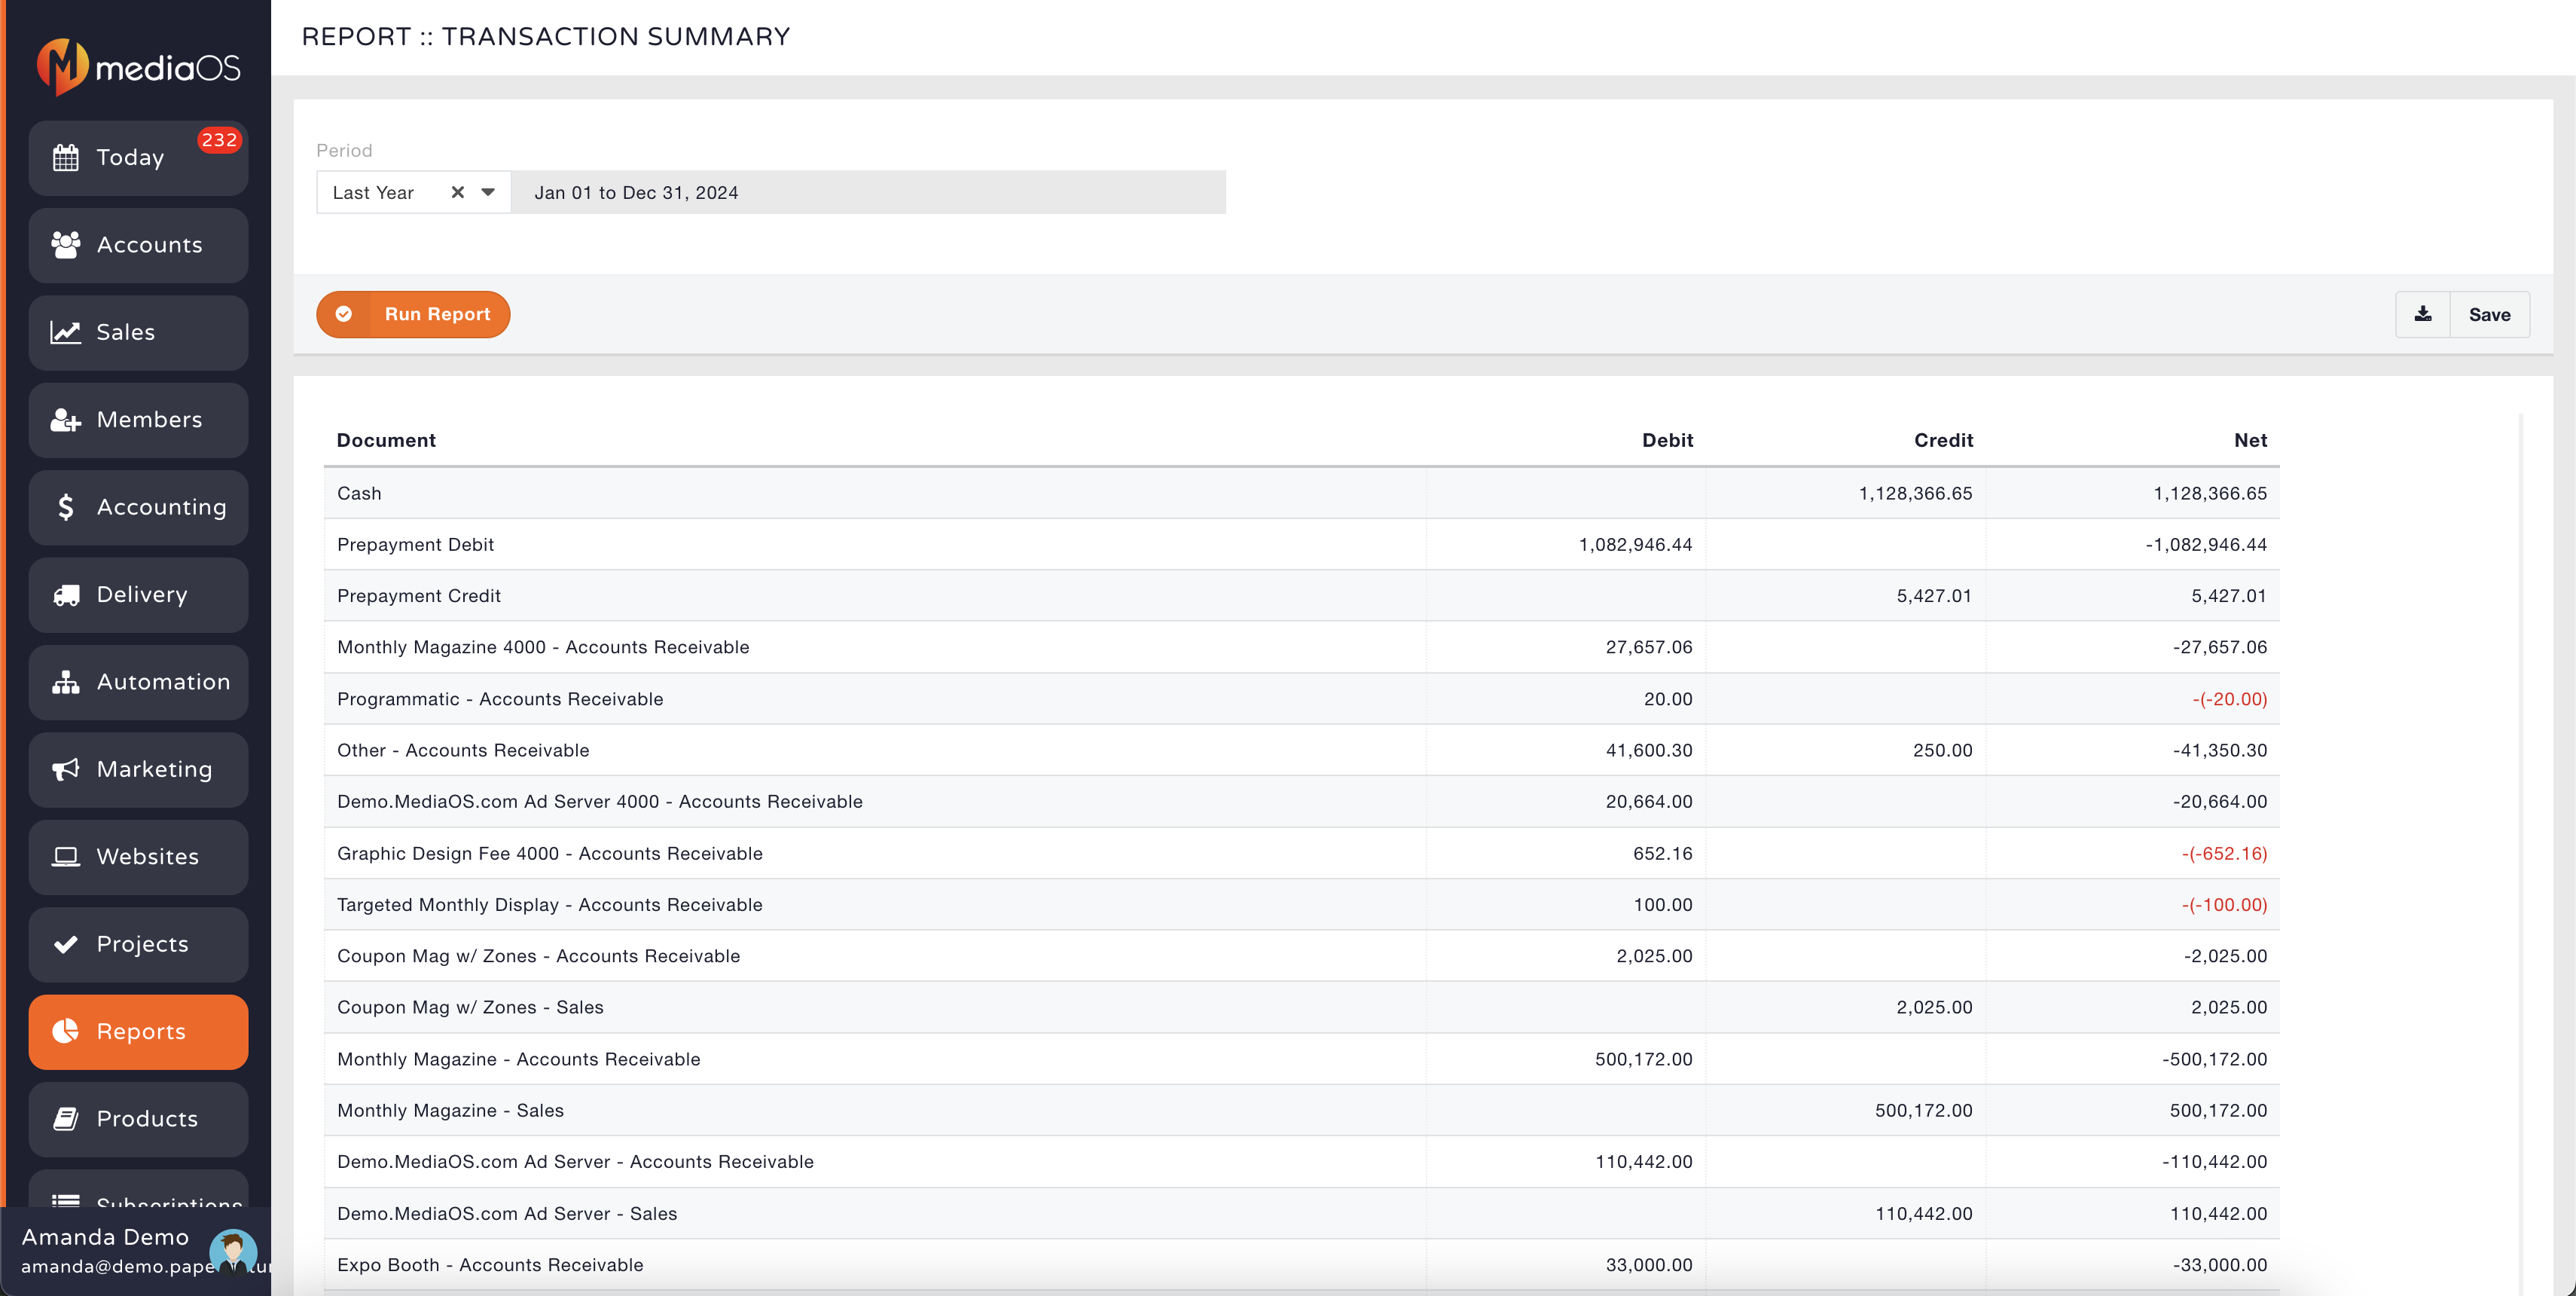
The Transaction Summary Report offers a higher-level overview by aggregating transaction data across multiple products, making it ideal for executives or accounting teams that want a broad view of revenue performance. This report typically displays total payment amounts, revenue by product, and payment methods used, allowing you to quickly assess financial performance over the period you specify.
To access the Transaction Summary Report, go to the Reports tab in MediaOS and click on Transaction Summary Report. Once the report opens, use the filters at the top to select the specific time range you want to analyze. This flexibility helps you easily generate monthly, quarterly, or annual financial snapshots depending on your reporting needs.
If you find yourself using this summary frequently, you can also save it to your dashboard. After applying your filters, click Save on the report screen, and follow the prompts to assign it to your dashboard, just as you would with the regular Transaction Report.
Note: Adding the Transaction Summary Report to your dashboard ensures quick access to key financial insights whenever you need them, keeping leadership and finance teams informed at a glance.