The dashboard is your one stop shop to see important information at a glance.
Adding Widgets to Your Dashboard
- On your main dashboard, click the name of the dashboard you wish to add a widget to on the top navigation bar. Note: If you only have one dashboard skip to step two
- Click + Add Widget in the top right corner.
- Select the widget of your choice.
- Drag and drop the widget to the place you want it to live on your dashboard.
- Click and drag the bottom left-hand corner of the widget to resize it.
The following widgets are available on the dashboard:
| Widget Name | Description |
|---|---|
| Accounting | A report that displays the amount of un-invoiced line items and the value of invoices that are 90+ days past due. |
| Action Overview | Displays all meetings, tasks, follow-ups, etc. you are scheduled for on a given day. Click on the date field to change the day you're viewing. |
| Activities | Displays total sales attributed to the user, the amount of appointments, calls, emails, follow-ups, and tasks due attributed to the user. |
| Activity Feed | Displays activity for all users in the system. Note: you can exclude emails from appearing in the activity feed in System Settings. |
| Advertiser Last Run Date | A report that shows a list of accounts and the day their last line item is running. |
| AR Summary | Accounts receivable report that displays totals for unpaid invoices, both overdue and not due yet, and payments, both applied and unapplied, for the last 365 days. |
| Text Widget | The Text Widget is a text editing tool. Once this widget is added to your dashboard select the three dots in the top right order and select edit. Great for drafting documents. |
| Embed Web Content | Allows you to embed the feed of another website on your dashboard. |
| Expiring Contracts | Displays a list of contracts with upcoming expirations. |
| Favorite Reports | Displays a list of reports you've favorited. |
| Flat Plan Inventory | Displays an inventory report for flat plans within the next 6 months. |
| Floor Plan Display | Shows a live view of your floor plan with sold and remaining inventory. |
| Getting Started | Great for new users! This widget provides direct access to the knowledge base, future and past trainings, and allows support contacts to schedule support meetings. |
| Invoice Aging | Displays an invoice aging report for unpaid invoices. |
| Issue Statistics | A customizable report for reporting on specific issues. |
| Past Due Invoices | Displays a list of all past due invoices. |
| Recently Won Contracts | Displays a list of contracts won within the time frame selected. |
| Sales | Displays a total of a user's sales and commission |
| Sales Goals | Displays sales goals that have been created by an administrator or sales manager |
| Saved Reports | Allows you to add a custom saved report directly to your dashboard. |
| Calendar | Displays a live view of your calendar. Note: Your calendar must be synced with mediaOS before using this widget. |
| Commission Next Level | Displays a list of users and the total amount they must sell to reach the next commission tier. Note: Commission tables with multiple tier brackets must be created by your administrator to use this widget. |
Sharing Your Dashboard
- On your main dashboard, click the name of the dashboard you wish to share on the top navigation bar.
- Click Manage in the top right corner.
- The pop-up that appears shows all your dashboards and their current status (whether shared or private). Note: What people on your team are able to see is dependent on the security settings you have listed in your account. If you have your account open, then when you share this dashboard, everyone will be able to see everything on it. If you have your sales user security turned off, they’ll only be able to see their own numbers on this dashboard when you share it.
- Click the toggle next to the dashboard you want to share. Tip: If this dashboard is shared with someone who no longer wishes to see it, they just have to click the three lines on the left of the dashboard and drag it to the Hidden section.
Adding Custom Reports to Your Dashboard
- Click Reports on the left navigation bar.
- On the next screen, scroll down to the Sales Management Section.
- Click on the Product Sales Summary & Analysis report.
- Using the filters at the top, build your custom report.
- Click Run Report.
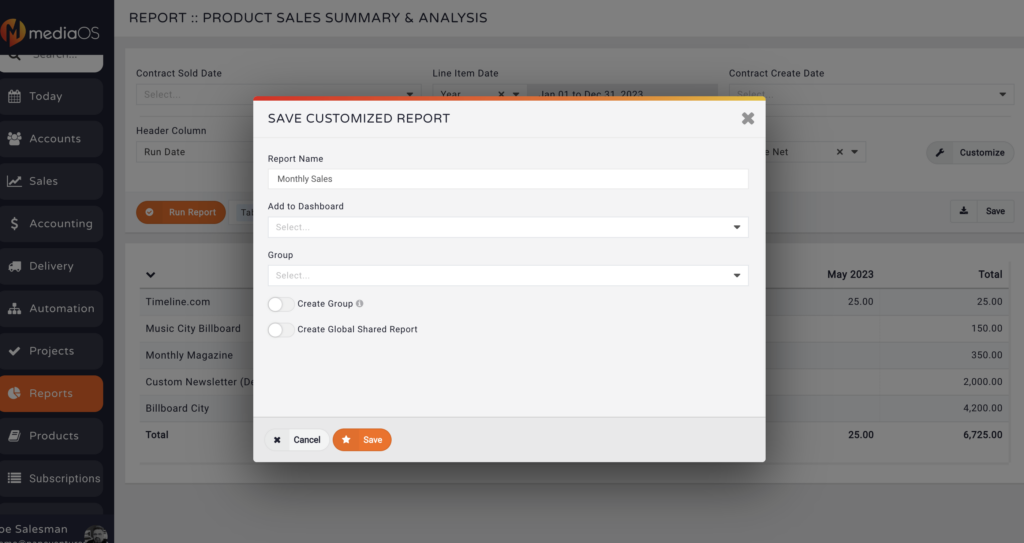
- Click Save above the report on the right.
- Name the report under Report Name.
- Choose which dashboard you’d like to add this report to under the Add to Dashboard dropdown.
- Click Save.
- Navigate back to your homepage.
- You should now see your custom report on this dashboard. Tip: You can rearrange, remove, or resize this custom report on your dashboard.